Spreadsheet Modelling – Assignment 4
Problem Solving with Spreadsheets [P1]
Spreadsheets offer an easy way to process a great amount of data in a number of different ways with ease. For many small- to medium-scale situations Excel or similar applications are the easiest and quickest approach in order to generate manageable and easily understood statistics. Excel can also be used to create forms for data input, as demonstrated in an earlier assignment, as well as to generate sample data to use for other tasks.
Goal Seek
A form of "what-if analysis", Goal Seek in Excel allows the value of a particular cell in a spreadsheet to be changed without affecting the spreadsheet permanently. This means that the user can view the spreadsheet as it would appear if different data had been entered in the worksheet. This is useful for projection of results and the success of a business, for example. Goal Seek is able to automatically change the value of one cell until the value of another equals a predetermined desired value.
Generation of Data
As an example, a developer may be building an application to handle numbers in a particular way, such as decide whether the given number is odd or even. In order to test the application with a batch of values the user could enter
 Use of the
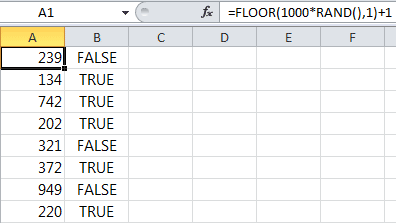
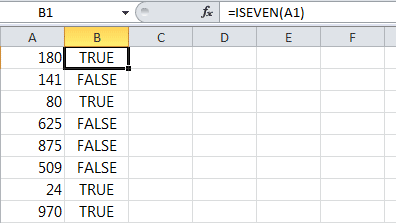
 FLOOR(), RAND() and ISEVEN() functions to generate a column of random integers between 1 and 1000 (inclusive). The CEILING() function is not used as a value of zero returned by RAND() would cause an output of zero, which is lower than the intended minimum. 1 has been added to the result of FLOOR() so that the final result can reach 1000, and the lowest does not drop below 1.
With the formulae above, the developer could generate a great batch of integers and whether or not they're even. These could then be fed through the application and the results compared with the output from Excel. This would allow the efficiency and accuracy of the application to be analysed, as well at its performance when processing a great amount of data.
Data Interpretation in Business [D1]
The core purpose of Excel is to make the collection, management and modifications of data easier, and to enable people to quickly draw conclusions from the information. In order to make data interpretation and presentation easier when working with great amounts of data in a business or organisational environment, a number of features have been developed for Excel.
What-If Analysis
What-if analysis refers to the three ways in which values of cells can be temporarily changed in Excel, or order to observer the effect those changes have on the rest of spreadsheet, particularly on formulae and functions.
Goal Seek
As mentioned before, Goal seek allows the automatic changing of a cell's value in order to achieve another value in another cell. Excel takes the functions in other cells into consideration, and finds the first value for one cell which would generate the desired value in another cell. Goal Seek is typically used in business contexts to estimate the number of sale required in order to reach a given profit, for example. The process behind Goal Seek is essentially is reverse-working the functions in the spreadsheet, by performing the opposite of the actions they do.
Scenarios
Scenarios allow for an array of data to be stored by Excel than can be substituted into particular cells on the spreadsheet. This could be used, for example, to store sales data from number of different years on a single spreadsheet, and within a relatively small amount of space. The substitution values can be added from another worksheet, for example, and then selected from an interface. All of the formulae, functions, graphs and such will update accordingly, granted that the data is of the correct format. This change is similar to Goal Seek in some ways, but rather than changing the values of one cell until the value of another is as desired, scenarios simply change the values of cells based on the pieces of information it has been given.
Several arrays of data can be added for a single cell range, meaning that a company could build a spreadsheet with a graph showing their sales per month over a year. Instead of needing to plot a graph spanning several years, or having to use separate plotted lines for different years, they could use scenarios to store the information about previous years and then quickly switch year as needed. Any graphs would therefore be more concise – only needing 12 plotted points – and would instantly update.
Cost Benefit Analysis
Often referred to as CBA, cost–benefit analysis lets a user determine the effects of multiple Goal Seek operations. Occasionally, a problem can have multiple solutions. In order to gauge which of the solutions would leave a business in the best position, considering losses, CBA is used.
For example, a shipping company could decide that they wished to reach a particular profit over the following financial quarter. In order to do this, they could raise the price of shipping but promise a particularly fast and reliable service, or they could lower the pricing of their services, thereby attracting more customers and achieving their goal. In the first situation they may lose money as a result of deterred customers, but in the second they could lose money by charging too little. Cost–benefit analysis makes the process of viewing all of the possible routes to a given goal – and the potential damage taking such routes could cause – easier.
Data Mining
When handling very large data sets, data mining can be used to generate vast amounts of metadata. By incorporating aspects of AI research and database management, programs can be built to analyse data by a number of measures. Perhaps one of the most complex, interestingness, looks at a piece of data and ranks it relative to other data entries based upon its relevance to modern events, inclusion of particular keywords, length and generated response, if public. The essential purpose of data mining is to extract pieces of information about the data set so that it can be summarised and better understood. It's important to note that the data itself is not of interest, but rather the conclusions that a computer can be taught and can learn to make from data.
There are sub-types of data mining, most commonly including cluster analysis, anomaly detection and association rule mining. These different processes can be used dependent on what the user or client desires to know.
Trends and Forecasting
It's common in spreadsheet modelling to wish to expand a data set so that predictions can be made. For this purpose, trends and forecasting functionality has been built into Excel. To take an example, the TREND() function can be used to continue a set of data linearly, by being given a set of known x and y values, and a set of known x values that have no corresponding y value. This means that given the average profit of a company each month of the year over a two year period, trends could be used to predict the outcome of a third year. This is very valuable in business, and more advanced forecasting and trending software is available as a result.
Interpretation Methods
There are many different ways in which Excel can be used to interpret a set of data. Although the most obvious way may be the easy generation of charts and graphs to represent findings, there are many other methods in Excel.
Excel's primary purpose is arguably to allow the collation (or bringing together) of information from different sources. The layout of spreadsheets makes this process easy, and enables users to process data efficiently.
Processing by way of functions and formulae is perhaps the most common use of data interpretation. By processing data and generating further values, more informed conclusions can be drawn about the information.