Spreadsheet Modelling – Assignment 3
Testing the Data Collection Spreadsheet [P7]
Plan
In order to ensure that an Excel form works as intended, testing is typically required. So that the testing would be as effective as possible, and would reliably target all aspects of the form, I decided to create a test plan, shown below.
To begin, open the form workbook as it would be opened on a computer in the tourist information offices. In order that any users cannot tamper with any of the settings, such as the spreadsheet's password protection, most of the ribbon tabs should be hidden and remainder collapsed:
1. Open the Excel settings window by clicking File > Options.
2. In the window, click the Customise Ribbon button on the left, and then untick the all but the Home tab in the box on the right.
3. Click OK before double clicking the Home tab label in the ribbon, which will make it collapse by default.Confirm that Excel has loaded the correct worksheet, and that the tabs for the other two worksheets do not show at the bottom of the window.
Ensure than the cell selection is in the first input cell, E8. The date field above should already be filled in with the correct date using the
TODAY()function.Fill in the form cell by cell. Using the Tab key in the upper left of the keyboard or the Return key, the form can be moved through easily. Because the cells in between the input fields are locked even to selection, Excel should only place the cursor in the fields requiring input; those in column E on rows 8, 10, 12, 14, 16, 18, 20 and 22.
When typing a response into one of the form cells, Excel should ideally auto-complete using the lists of data provided by the reference worksheet. The is the case for the Country of Residence input cell but not the Comments cell, for instance. The auto-completion means that users can enter data that can be efficiently processed by the spreadsheet and used in statistics, while still entering the data in a perhaps more familiar way than the drop-down menu.
If incorrect data is entered into the form, such as a country name without a capital letter at the beginning, the spreadsheet should throw an error and display a window to the user informing them to use the drop-down menus available in most of the cells. For some cells, the option to not change the data is presented, accounting for particular cases that may not otherwise be covered by the options given. The Gender input cell is among these.
When the form is complete and the submit button pressed, there should be a short delay before a window appears confirming that the form's data has been successfully submitted to the database worksheet. If this does not appear, an error has occurred in the execution of the submission macro. This is an issue that must be attended to by a developer or possibly a member of staff, likely with the aid of the technical documentation.
In Practice
I tested the spreadsheet and followed the process outlined above. The only area in which the spreadsheet failed to pass was the auto-completion. I was under the impression that a cell with list-based Data Validation enabled would automatically have auto-completion enabled, but this seems not to be the case. There may be an option in the Data Validation window to enable this feature, otherwise it may just not be available. Was I to create the form and data submission system again, I would likely research into this in greater detail.
Spreadsheet Data Formats [P8]
So that the data processed in the original spreadsheet would be available and accessible to as many people and computers as possible, I exported both of the spreadsheets two common formats:
The first, CSV, is a text-based format, with values separated by commas. Unlike Excel's
*.xlsxformat, CSV files are not specific to any particular software package, meaning both proprietary and free spreadsheet editing software can read the file. That said, the format is very basic, and does not offer as much functionality.The second format was HTML and CSS, also both test-based. These use a variety of different syntax elements to express a website in terms of code. This can be read by a web browser such as Google Chrome or Firefox, meaning it has very good compatibility across different operating system platforms. It can also be easily viewed on mobile devices.
The contents of the HTML export are also shown below.
Exporting to CSV
In order to export the data collected from visitors to the tourist information office each month, follow the steps below:
 1. Firstly, the spreadsheet containing the data must be un-hidden. In order to allow worksheets to be hidden and un-hidden, navigate to the *Review* tab in the ribbon and click on *Protect Workbook*, which should already be highlighted. The password to allow this is simply `password`.
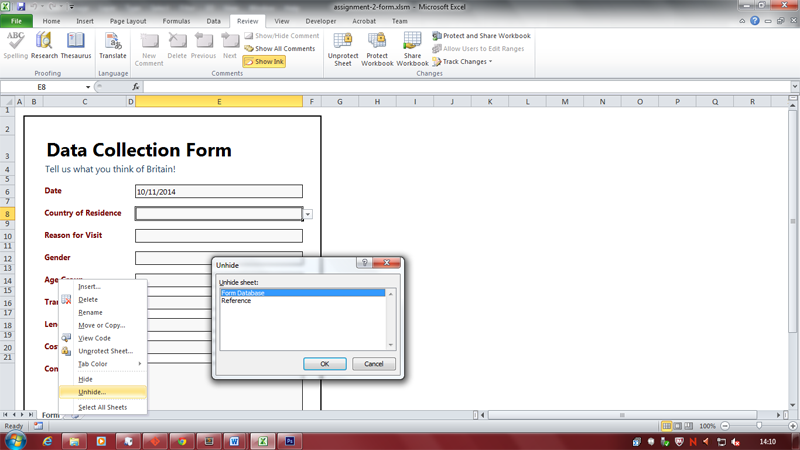 2. We must now un-hide the database sheet, by right-clicking on the *Form* worksheet tab in the bottom left, clicking *Unhide*, selecting the *Form Database* worksheet, and then clicking OK. The results should now be shown on screen.
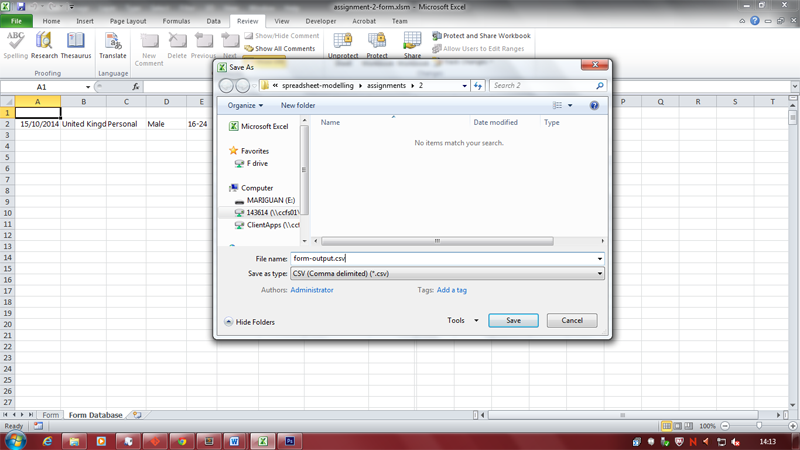 3. To export the data, click *File* on the ribbon, and then *Save As*. In the dialogue box that appears, select *CSV (Comma delimited) (\*.csv)* in the *Save as type:* drop-down menu. Give the file a name and choose where to save it on your computer. Once this is complete, click the *Save* button in the bottom right.
 4. Remove the protection on the database worksheet, by navigating to the Review tab once more and clicking *Unprotect Sheet* button. Again, the password is `password`. This allows us to remove the data in the spreadsheet.
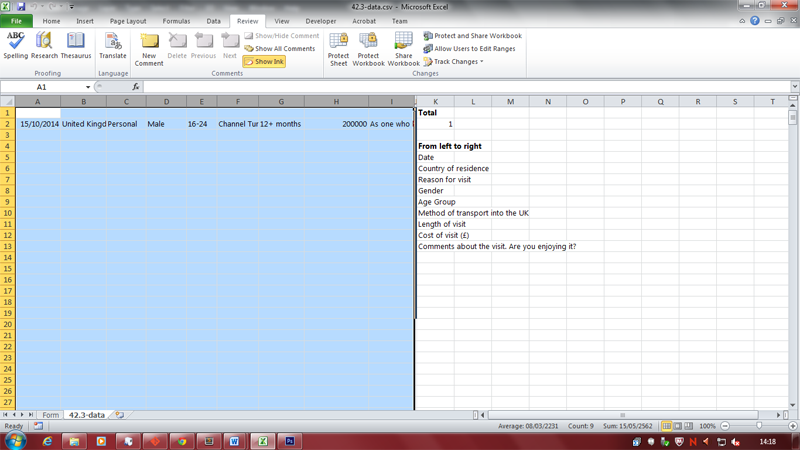 5. Select the data columns by clicking and dragging the mouse right-wards from the column A label to the column I label. This selects all of the data provided by visitors, regardless of how far down the spreadsheet it it.
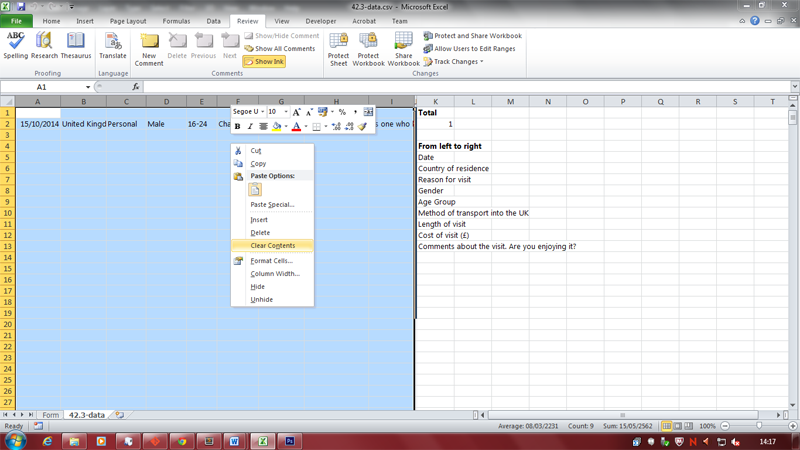 6. Right click anywhere in the selected area, and then click *Clear Contents* to remove all user-submitted information. Place the selection in cell A1 before proceeding.
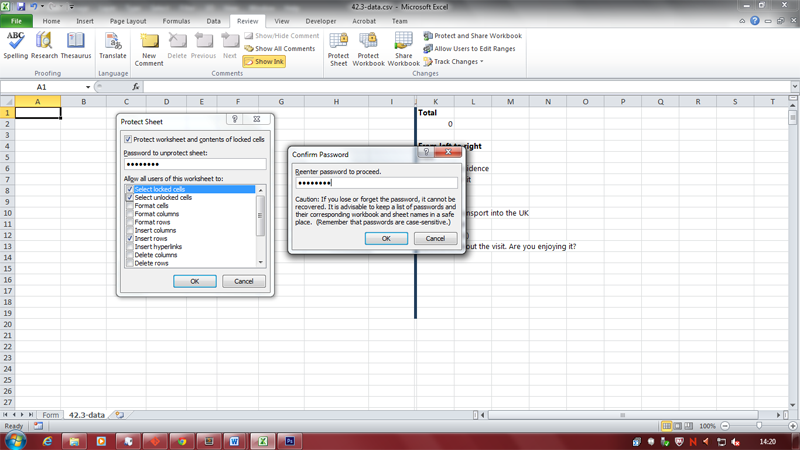 7. Re-protect the spreadsheet by clicking the same button used to un-protect it previously, now labelled *Protect Sheet*, and un-tick the two selected tick boxes. Enter `password` in the password entry box, and click OK. At this point you will be prompted to repeat the password you entered.
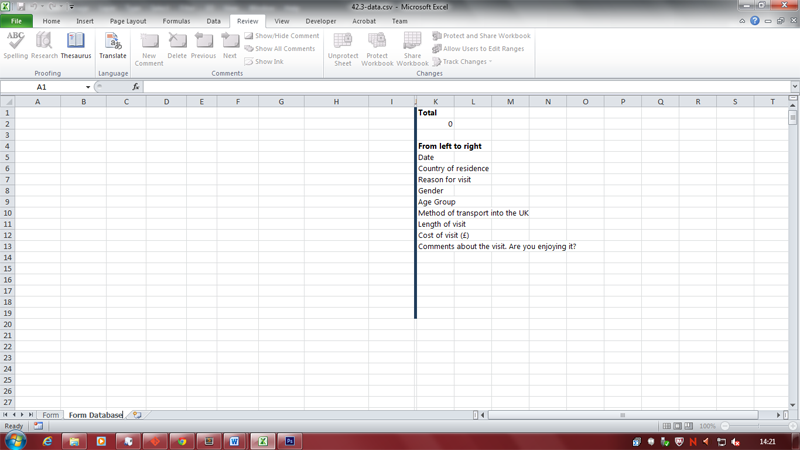 8. Rename the worksheet to "Form Database" by double clicking the name in the lower left.
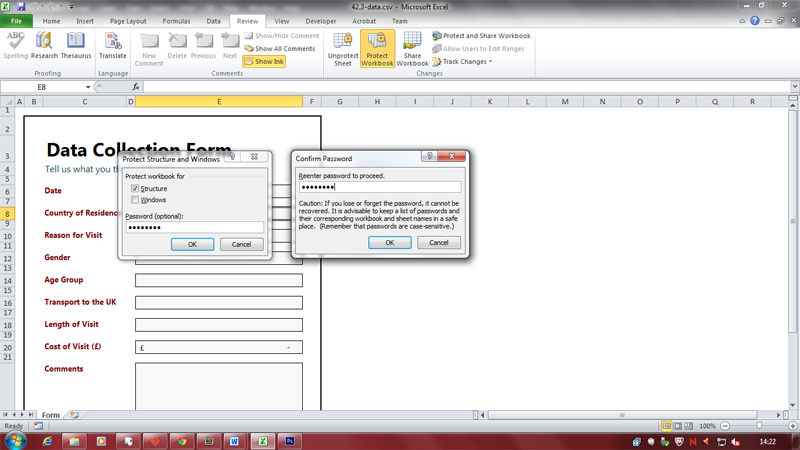 9. Right-click on the database spreadsheet label in the bottom left, and click *Hide*, and then click *Protect Workbook* in the *Review* tab. Enter `password` once more and confirm it when prompted.
Save the spreadsheet and exit. Send the CSV file generated by Excel to the database manager.
Alternatively, you may instead only proceed to step three, then close Excel without saving changes. Delete the Excel spreadsheet, and then re-download it from the file-server it was originally obtained from. This will give you a fresh copy, with workbook structure and password protection already configured as it should be.
| 10/11/2014 | Sweden | Personal | Female | 55-64 | Sea, in private vehicle | 3-6 months | 12000 | Although the circumstances which brought me here were not good, the landscapes and facilities in the UK have helped me greatly. |
| 10/11/2014 | Japan | Business | Male | 35-44 | Air | 1-3 nights | 60 | My accomodation has been wonderful, and the afternoon I was able to spend sight-seeing was very interesting. |
| 0/11/2014 | Andorra | Holiday | Female | 25-34 | Air, on foot | 14-27 nights | 6000 | I have enjoyed my stay in London, and trips out into the countryside. Stone Henge was particularly impressive! |
| 5/10/2014 | United Kingdom | Personal | Male | 16-24 | Channel Tunnel | 12+ months | 200000 | As one who has spend the vast majority of 16 years in the UK, I can honestly say it ain't all that bad. Bit damp sometimes, but oh well. |
Evaluation and User Feedback [D2]
In order to gauge how successful the model and feedback form spreadsheets were, suggestions and analysis was gathered from a classmate.
Spreadsheet Model
Styling and Themes — The spreadsheet uses consistent styling, using company colours defined throughout the spreadsheet modelling project. The typography is also consistent, but unfortunately not all monetary data is in the correct currency format.
Layout and UX — Navigation is present in the Assignment 1 spreadsheet, and conditional formatting has been used to make certain pieces of information more noticeable. Despite this, the colouring used for Conditional Formatting means that the effect is not as effective as it could be. The information is well laid-out, however, and can be easily understood.
User Requirements — The user requirements outlined in the brief have mostly been met.
Menu Page — The most up-to-date spreadsheet does not have a visible menu worksheet.
External Data Connections — These have been used to gather up-to-date information about currency exchange rates.
Formulae — The formulae on the spreadsheet perform necessary mathematical functions.
Functions — The following functions have all been used on the spreadsheet:
AVERAGE(),IF(),IFERROR(),IF(),AND(),VLOOKUP(),SUM(),COUNTIF().Conditional Formatting — This has been used, but not clearly in all cases.
PivotTables — A PivotTable has been used, and is helpful.
Charts — These have been used effectively, and use clear colours. They follow the colour scheme used by the rest of the spreadsheet.
Error Handling — IFERROR has been used to detect Excel errors, and the function has been used to clearly indicate these in the worksheet.
Security — All of the worksheets have been password protected, and the workbook protected in addition to this (preventing the (un-)hiding of worksheets). The workbook has then been shared, meaning that it cannot be un-protected until un-shared.
Feedback Form
Styling and Themes — The colouring, text weight and text size are all consistent, and follow the company theme.
Layout and UX — The fields are clearly laid out, and can be navigated through using the either the Tab or Enter keys. Using the Shift key as well allows the user to navigate backwards through the form.
User Requirements — The form sheet meets the brief's specification; it's easy to use and shows error message. That said, there are no comments shown when selecting cells, which would ease the process of data entry for inexperienced users.
Formulae — As before, simple mathematical operators have been used.
Functions — Few, but some, functions have been used;
CONCATENATE(),LENGTH(). They're used for the "x characters remaining" system for the last input field.Automation — A macro has been created using the Excel macro recorder, and then changed in the VBA editor. This macro moves the data in the user form to the database spreadsheet.
Lists, Input and Error Messages — Although no alerts are shown when selecting input cells, informative errors are thrown when entering invalid or disallowed data and list drop-down menus are provided in the appropriate cells.
Data Validation — The data entered into the form is checked either by list, range or length.
Security — The worksheet has been password-protected, and the workbook protected additionally. This prevents users from tampering with the spreadsheet formulae and layout.
Extra Comments — The form is not as user-friendly as it should be, considering that users of a wide range of technical ability will be using the form.
Response
I am happy with the theme that I developed throughout spreadsheet creation, and I feel it is effective. The typeface, Segoe UI, is clear and easily read at all sizes of text. It also has a dedicated bold version, which enables certain pieces text to stand out. The colouring used also means that the user can easily differentiate between different level headings. The colours I picked complement each other, and allow for a range of complementary colours to be used in graphs and charts.
I believe that the form in particular could use more clear labelling and information presented to the user when selecting each field of the form. This would mean that the less technology-familiar users visiting the tourist information office would still be able to comfortably complete the form. In it's current state, the form may discourage some from entering information, which would mean the form results would be skewed and would inaccurately represent the opinions of visitors.
I think that with minor adjustments, the spreadsheet could be used in a production environment, although I wouldn't recommend the use of Excel as a form-based data collection platform. Despite this, I do believe that the spreadsheets met the requirements outlined in the brief, and the model spreadsheet in particular.
The menu page, although visible on the Assignment 1 model spreadsheet, was not shown on the newer version of the spreadsheet due to my misunderstanding. If I were to create another model or develop the current version more, I would create a dedicated menu page, and include the functionality of the original one (such as VLOOKUP utility). By adding a clear menu page, the spreadsheet can be made a lot easier to navigate, and hyperlinks to other worksheets or cell references are all that are required to achieve this.
I believe the use of External Data Connections was successful, although I do feel data offered by MSN could be more concise. For instance, I would assume one could use a more capable finance API that would return only the values requested, which would be specified in the request address. This would reduce the time required to update the data, would make the process of using the data easier, and would greatly reduce the need for separate spreadsheet dedicated to the external connection. Despite it's possible inefficiency, however, the External Data Connection allowed for the accurate conversion between Euros and Pound Sterling.
I think that the functions and formulae I used were sufficient, and met their requirements. I feel like the use of VLOOKUP was also successful in extending upon the data already provided, which wasn't a documented requirement.
Conditional Formatting could have been used to greater effect had I picked more contrasting and saturated colours, which I decided against initially as they appeared to be excessively attention-grabbing. Other than the choice of colours, I believe the range of different conditional formatting rules available in Excel was used effectively.
Personally I feel that PivotTables have limited use, but that the use of them in the spreadsheet model showed one of their most useful features, asides from the flexibility in creation; the expand and collapse functionality on groups of data. This allows a great amount of data to be available on a spreadsheet, and without consuming a large number of cells initially. Without collapsing or hiding rows or columns, which can be cumbersome to reveal again, the PivotTable allows information to be consolidated and summarised by category.
Overall, I believe the spreadsheets were successful, but both could benefit from further development.