Database Design – Assignment 2
Queries on Data [P5]
In order to select particular data within a database, one can use queries. Queries are a tool that allow for pieces of information to be extracted from large volumes of data, and are a key feature of database software.
Basic Queries
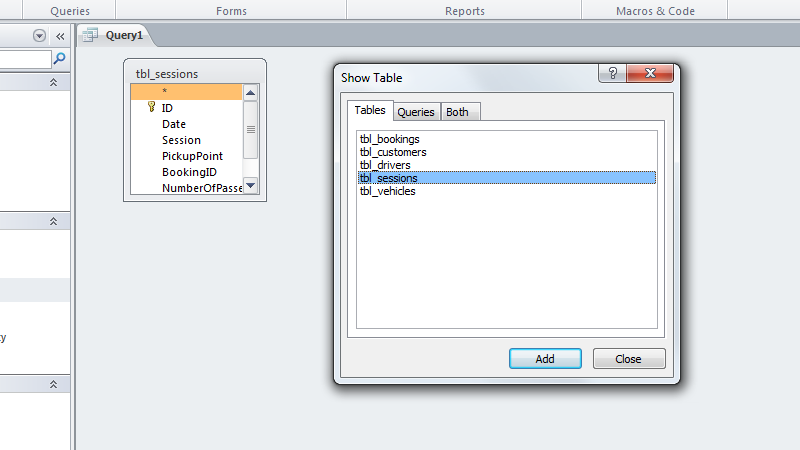
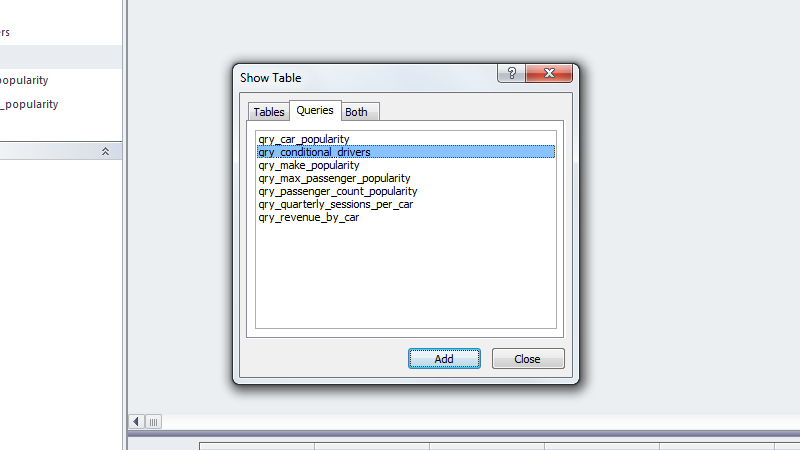
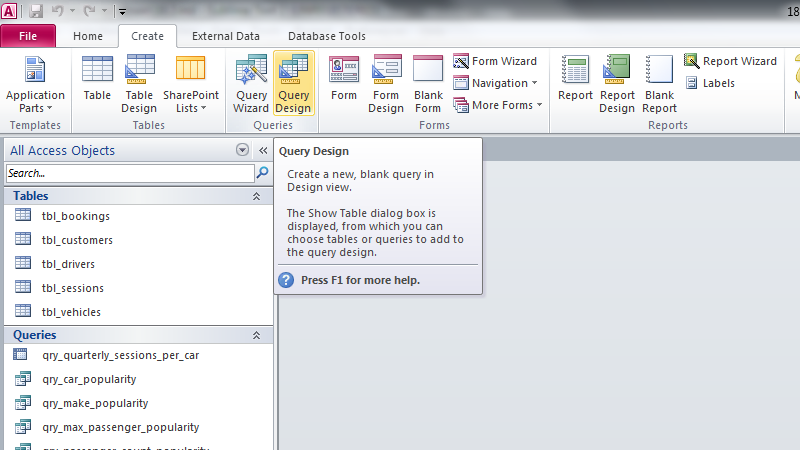 Queries are created in Access by entering the Query Design mode.
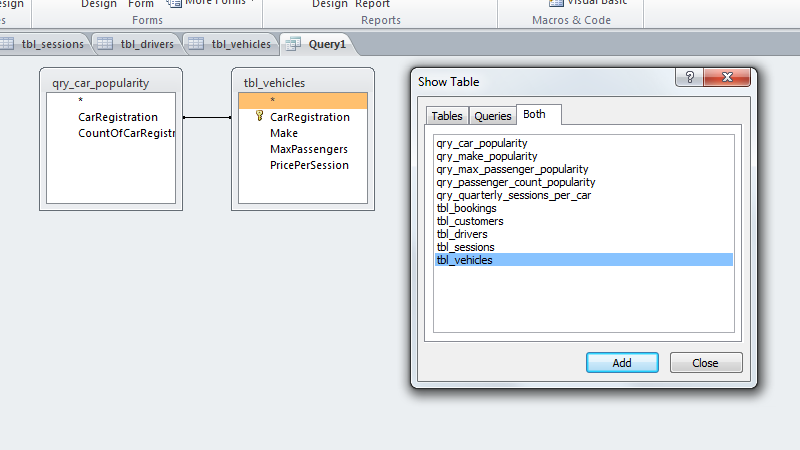 A list of tables and other queries are shown, and can be imported into the new query as sources of data.
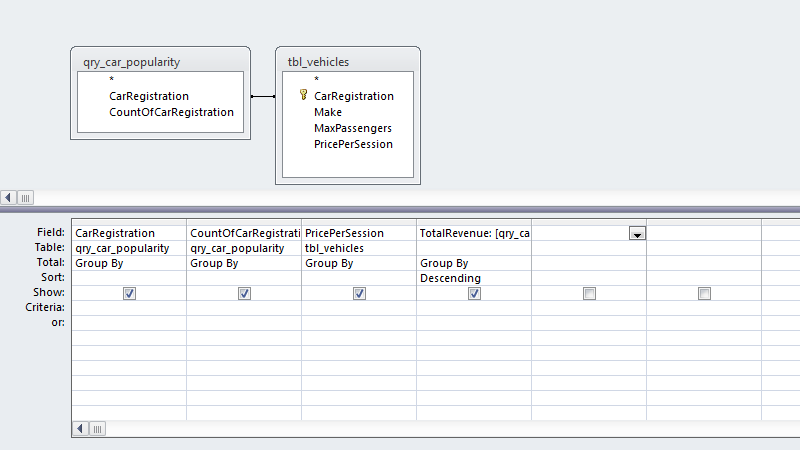 For the first query I created, I added three fields from two different tables, and added a fourth column containing an expression.
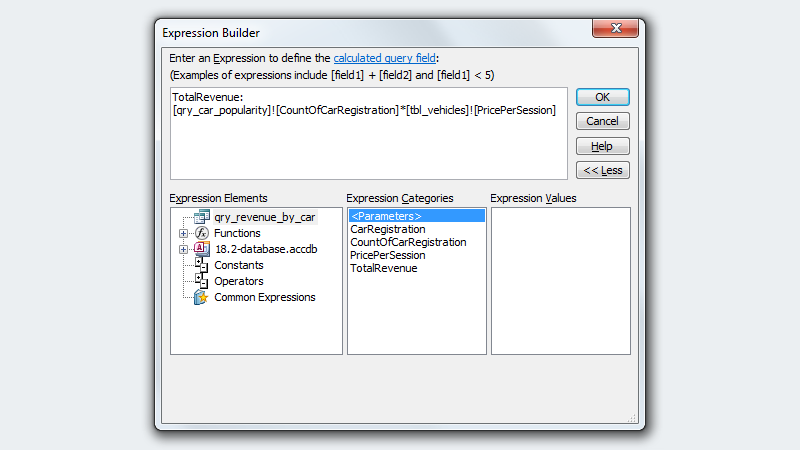 The above expression is used to multiply the values of two columns to generate a total collected revenue for each car in a fictional car-hire company's fleet.
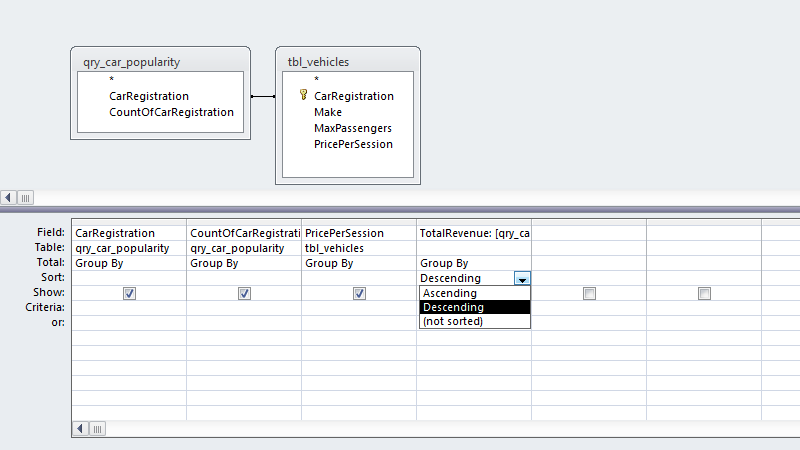 The last column, containing the expression, was used to sort the data, meaning that the highest-earning car would be at the top of the data generated by the query when run.
Crosstab Queries
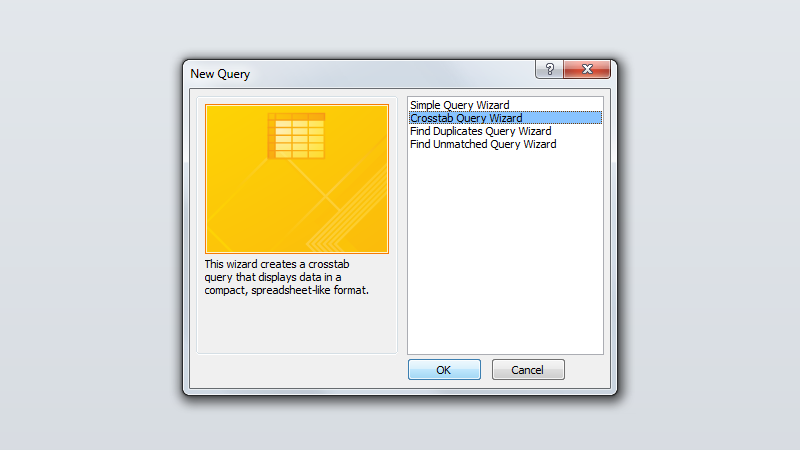 More advanced types of queries can also be created within Access. For example, the Crosstab query can be used for more complex queries containing more data.
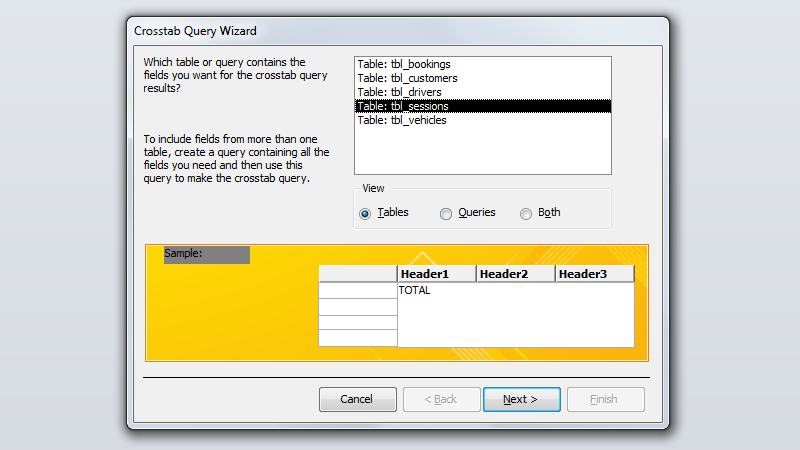 A single table is used when creating a Crosstab query.
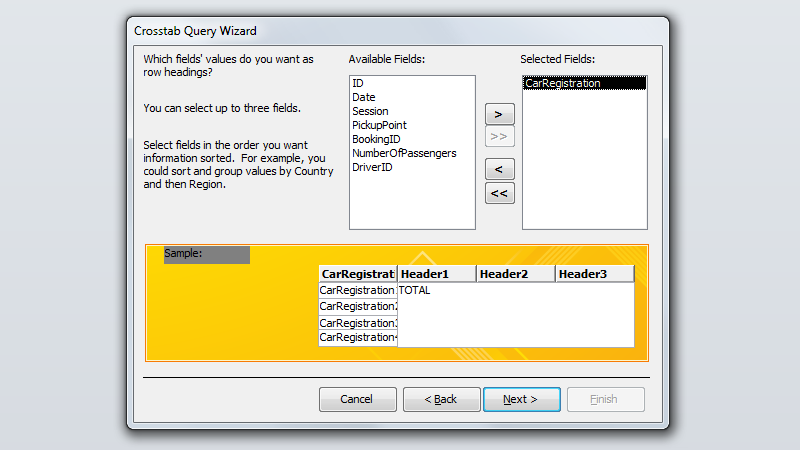 I used a single field from the table to use as headings for the final output's rows.
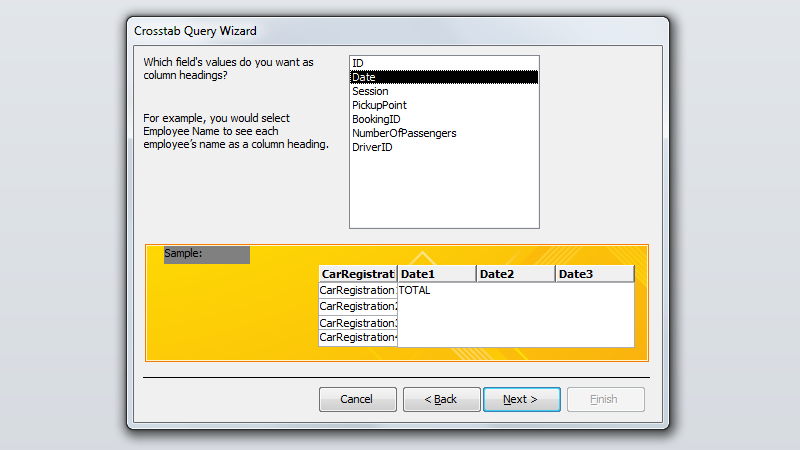 I picked another, the date, for the headings of columns.
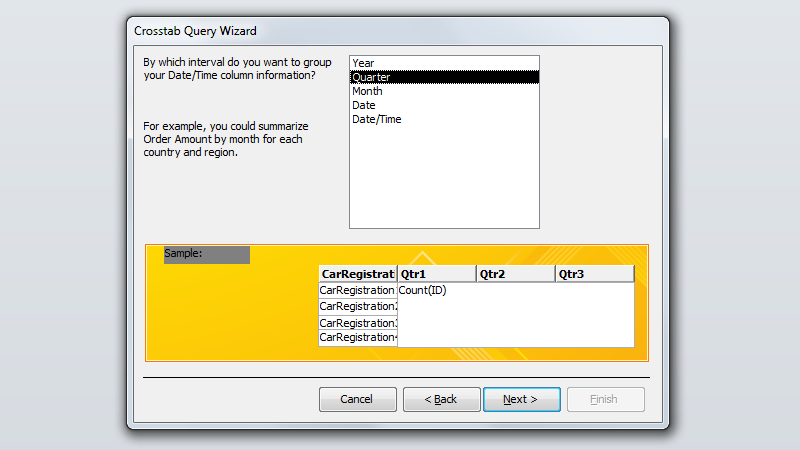 Using the built-in presets for managing time-based data, I requested to be shown data split in to quarterly (three-month) sections.
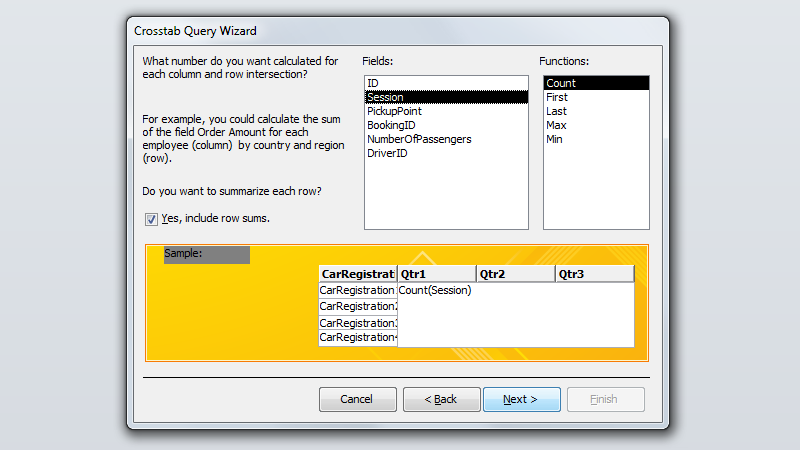 Access can be configured to summarise data in a number of different ways, and the counting function was used to calculate the number of sessions each car had been used for.
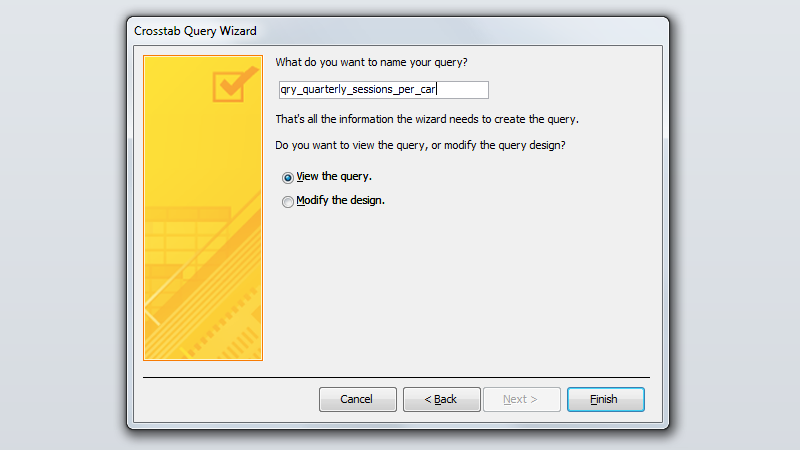 The last step of the Crosstab Query Wizard allows one to enter a name for the new query. The query I created was name according to the naming convention I had used before.
Conditional Queries
When the previously-detailed query times aren't sufficient, one can use conditional queries. These require data to be given to the software before the query is run, and this data is used to gather specific results.
 The
The tbl_sessions table was imported in order to query information about the drivers occupied on particular dates.
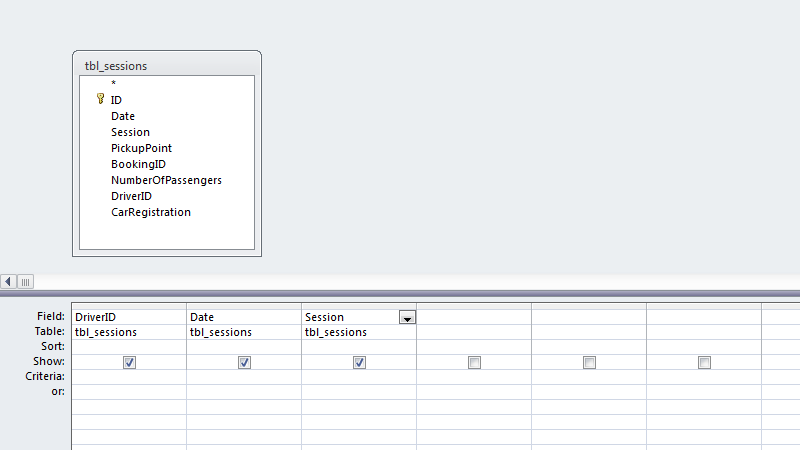 I used three fields from the table; the unique driver identifier, date of a session, and time of a session during the day.
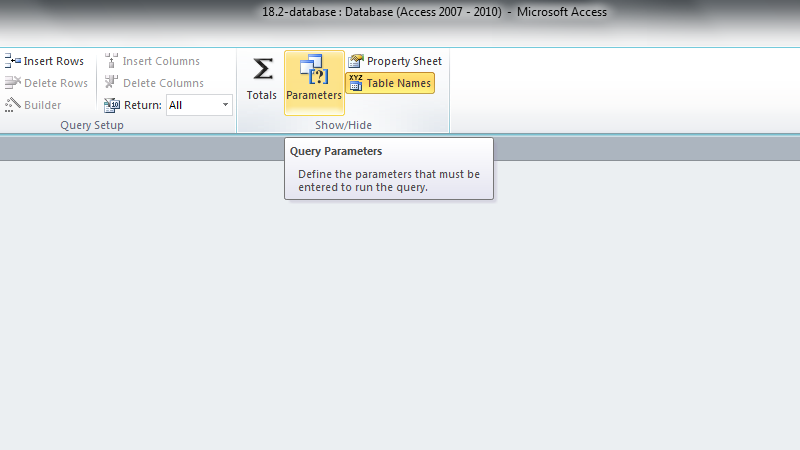 Parameters used when the query is run can be configured by opening the Parameters dialogue box.
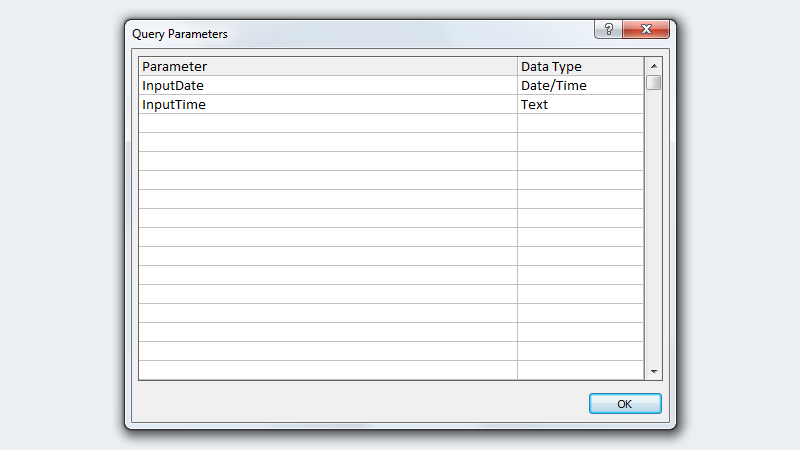 Two parameters were added for the query; the date of a session and the time during the day.
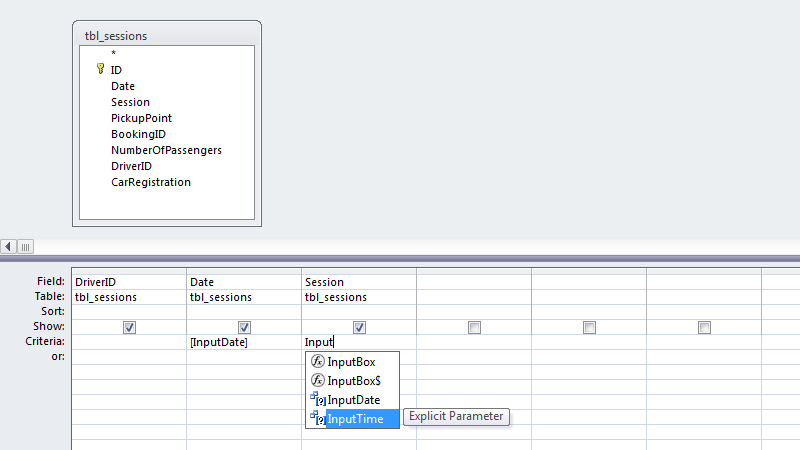 The values of the parameters were used in the design of the query, which will only show records matching the data given to it prior to execution.
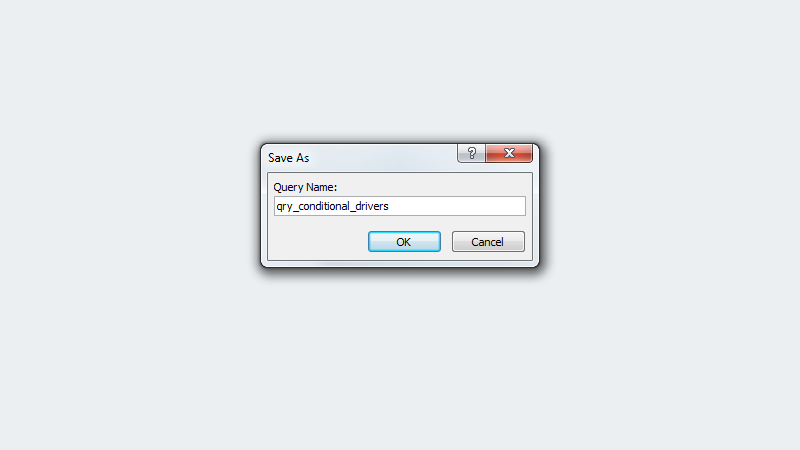 Finally, the query is given a name and saved.
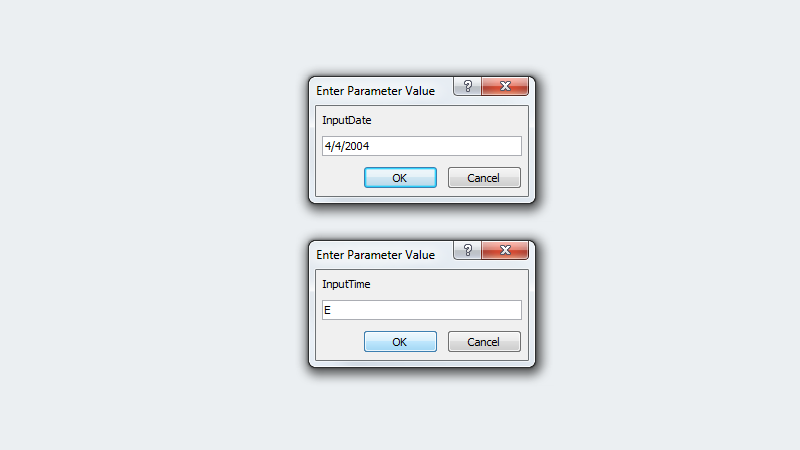 When the query is run, Access will prompt the user to enter a particular data and time, and the database will return data accordingly.
 The query will only show the records in the sessions table which match both the data and time of day specified before run-time.
 A new query is then created, starting with the original query, plus another table to provide more human-readable information.
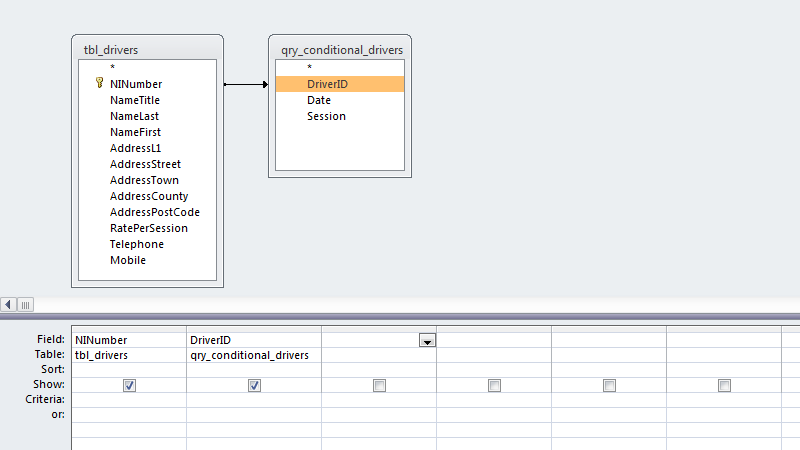 Next, the fields containing linked information in each of the tables are joined by dragging from one to the other.
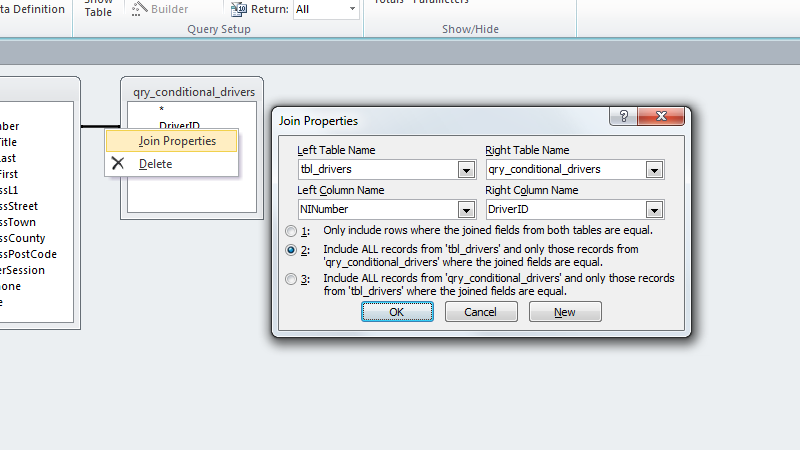 The new relationship join is right-clicked, giving access to its configuration. The relationship is altered so that all of the data from one table is shown, despite it not all matching the data in the other.
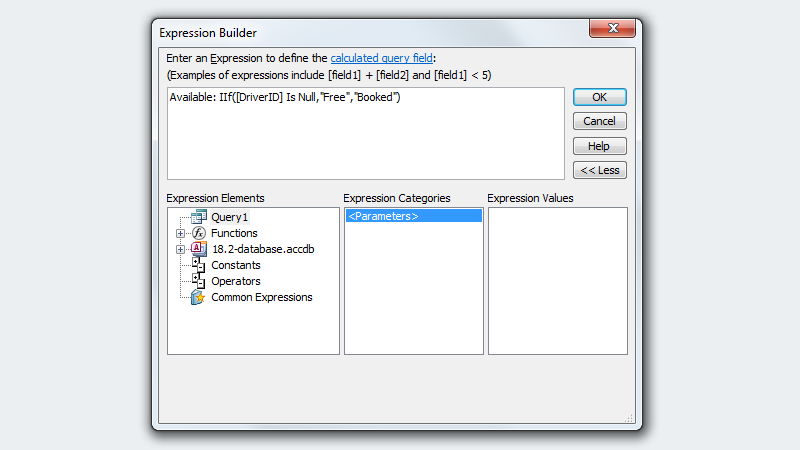 Next, the Expression Builder in Access is used to create a fourth column, containing an expression. This is used to determine whether a driver is free or not, based on the given information, and printing this information as a table column.
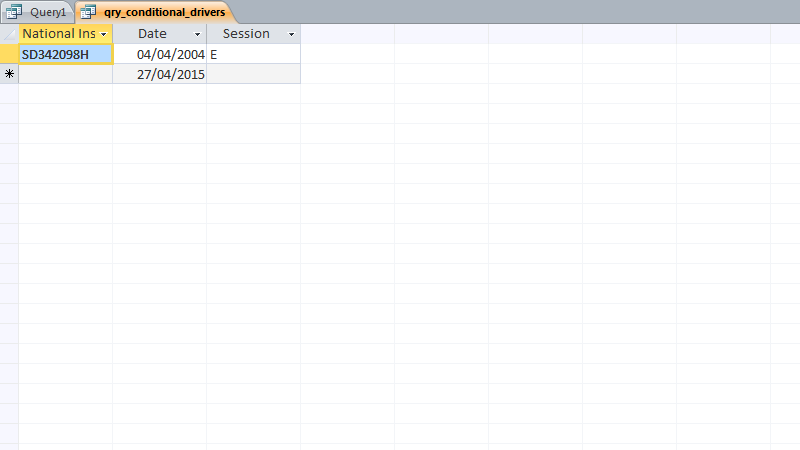
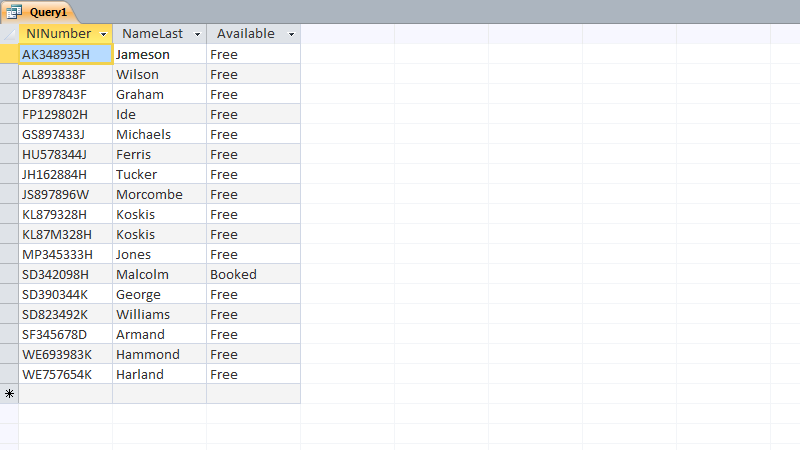 The query successfully shows a list of the drivers used by the company and whether or not each driver will be, is, or was free during a particular time slot on a particular day.
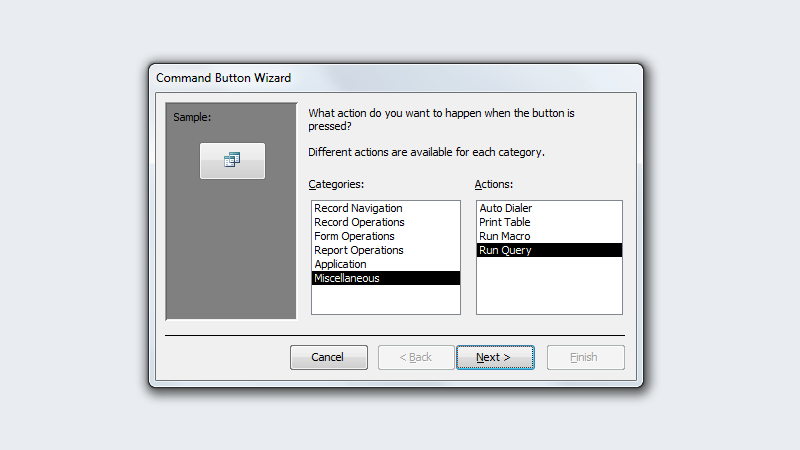 To make the query more accessible and conveniently placed, one can add a button to a form which will take the user to a query and run it. A button was created on the bookings form to check the availability of drivers on certain days. The same process was completed for vehicles as well as drivers.
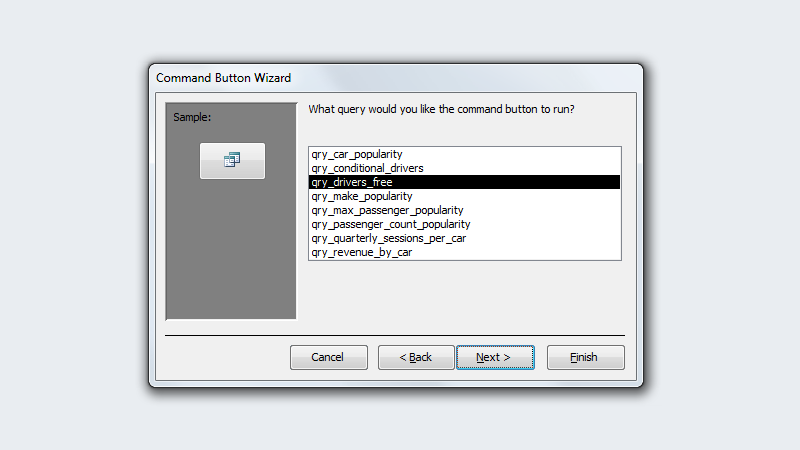 Once the button has been created and the option to run a query selected, the query to run must be chosen.
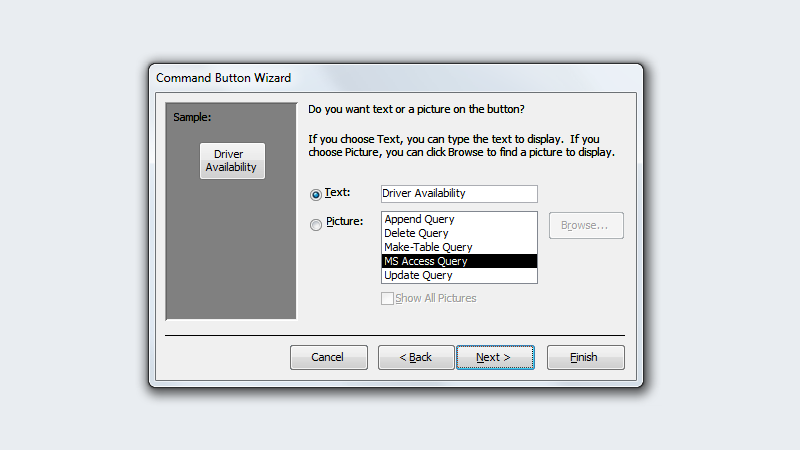 One can show either text or an image on the button, and I opted for the former to avoid confusion.
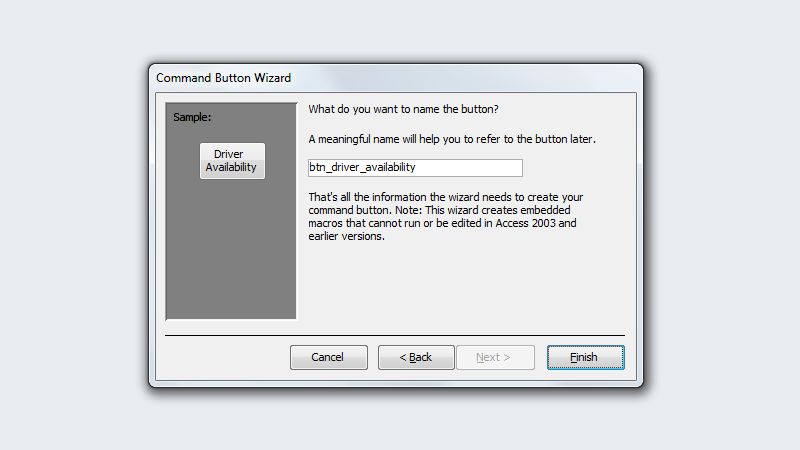 Lastly, the button is named to name it easier to identify in a list of form objects.
Making Data-Backed Decisions
One of the most common uses of a database is to generate useful information that can be used to inform decisions. By crafting and combining both simple and complex queries, one can extract very specific ranges of data and create more data from them. In the case of the S-Cars database, the data could be used to make an informed decision about what vehicle to buy if the company was looking to make a new purchase.
Having looked at the data and the graphs created as part of the M3 task, I would suggest that S-Cars buy a second ten-seater Chevrolet. I noticed that the Chevrolet with registration ME02 ZDS was used the most, sporting the highest total session count. I also noticed that it was either the most popular or joint-most popular car in the first and second quarters. In addition, I noticed that – despite groups of seven and ten people being most popular –business the vehicles with a capacity of twelve saw a lot of business, but I attributed this to the lack of slightly-smaller capacity limousines. I feel a ten-seater vehicle would comfortably accommodate a typical group of customers, and would be more time- and fuel-efficient than using higher-capacity vehicles as the business currently is.
Test a Relational Database [P7]
Black Box Testing
Design and Consistency
When creating the forms for entry of new data into the database, I used a PNG logo image created in Photoshop to identify the client with their branding. The logo is present on all of the forms in the same size and location, creating a sense of continuation and consistency between the different forms. I also used the same fonts and the same size of text for the labels and entry fields of the forms, and styled buttons in the same fashion each time one was created. I also attempted to clearly label the fields in which data must be entered, and laid out each form in a similar way. Using a consistent interface leads to a better end user-experience, or UX
Usability and UX
By creating each form with a common design theme in mind, I was able to create a consistent and straightforward user experience. With each form laid out in the same way, one is able to quickly understand what a particular form requires. As part of white box testing, I was able to confirm that the VBA macros written to generate booking and customer IDs work as intended, and that the forms work as they should do. These factors contribute to the resultant UX.
Typical Usage
I tested the database in some typical usage scenarios, and recorded the results of my testing below.
| Test | Expected Outcome | Actual Outcome | Pass |
|---|---|---|---|
| Creating a new customer | The database would accept the information, granted that this is valid, and would not report any errors to the user. | The form accepted a non-valid title, despite the fact that data validation should be in use to prevent this. | |
| Creating a new booking with sessions | Access would not display any errors during the creation of a new booking, and once the booking had been made, sessions could be added. | As expected. | |
| Adding a new vehicle | The databse would allow a user to easily add a new vehicle, which could then be used in booking sessions. | The database does not include a form for the addition of a new vehicle, while forms for customers, bookings and sessions are provided. | |
| Adding a new driver | A driver new to the company could be easily added tot he database and assigned to sessions. | The database does not include a form for the addition of a driver, while it does provide such an interface for the addition of other data. | |
| Easily using the database | The database provides forms for the easy entry of data, and these follow a common design pattern. A single interface design is used for each, avoiding potential confusion otherwise. | The database is intuitive to navigate and use with the provided forms. | |
| Feeling a sense of consistency and familiarity in the database | The database is consistent in appearance and in functionality and layout. The different forms follow a common theme and provide the user with a recognisable style by which to identify other S-Cars related content. | As expected. | |
| Deleting a vehicle or driver | The database prevents the deletion of a vehicle or driver record until no records can be found using the vehicle or driver record's primary key. This is a result of enabled, enforced referential integrity, and will show the user an error message when attempting to delete relevant records. | As expected. |
White Box Testing
Relationship Testing
In order to test that the relationships between different fields in different tables of the database were configured correctly, I turned to the Relationships view in Access. I inspected each link between different tables and ensured that referential integrity was enforced where appropriate.
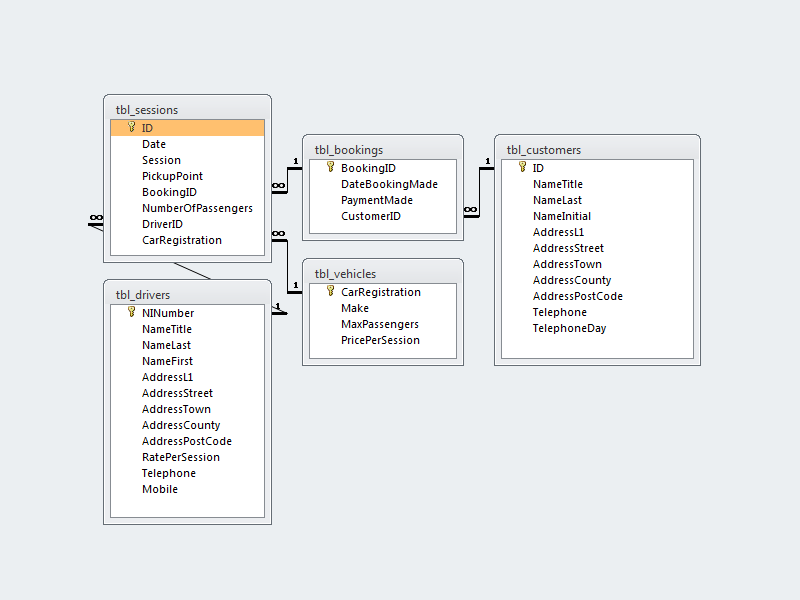 A screenshot of the the Relationships view in the S-Cars database is shown; all of the fields that must be linked are.
Referential Integrity Testing
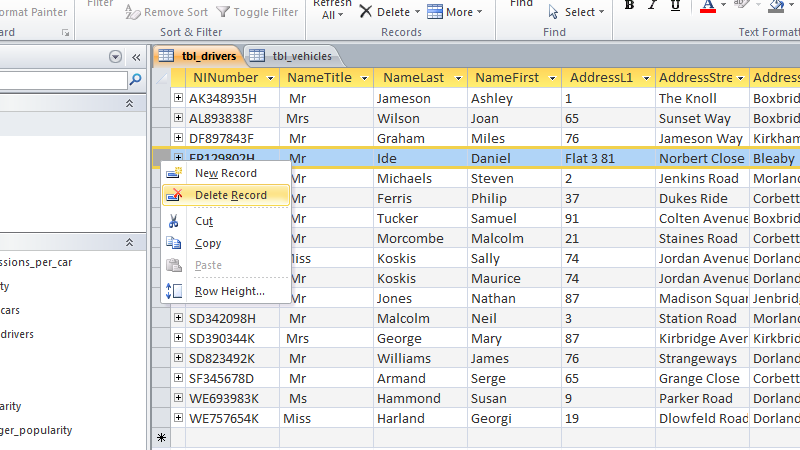 The option to delete a record is shown in Access and can be clicked.
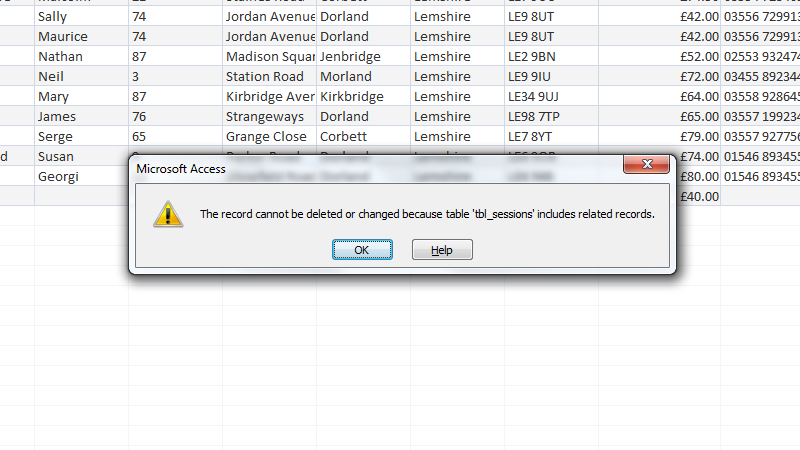 If the user proceeds, however, they'll be met with an error message, informing them that enforced referential integrity prevents record deletion. In the case of a driver being deleted, all sessions referring to the driver must first be removed. An organisation would likely rather simply mark the driver as inactive than do this.
Query Testing
In order to test that the queries I designed were working as expected, I analysed some of their outputs. Looking at the data returned by the queries, I was able to roughly judge their accuracy. If any data seemed erroneous or out of place, I would using the sorting and filtering tools available when viewing a table's contents to perform the query, or a similar one, and then compare results.
Validation Testing
In order to prevent the entering of false or wrongly-formatted information, input masks and data validation was used. I tested these methods by using the forms built for data entry and observing how Access would react when given particular information. I found that the majority of the data validation was working as intended, but that some was not, such as in the case of the title field in the customer table editing form. This was fixed by implementing a validation rule to only accept a limited number of strings in the field.
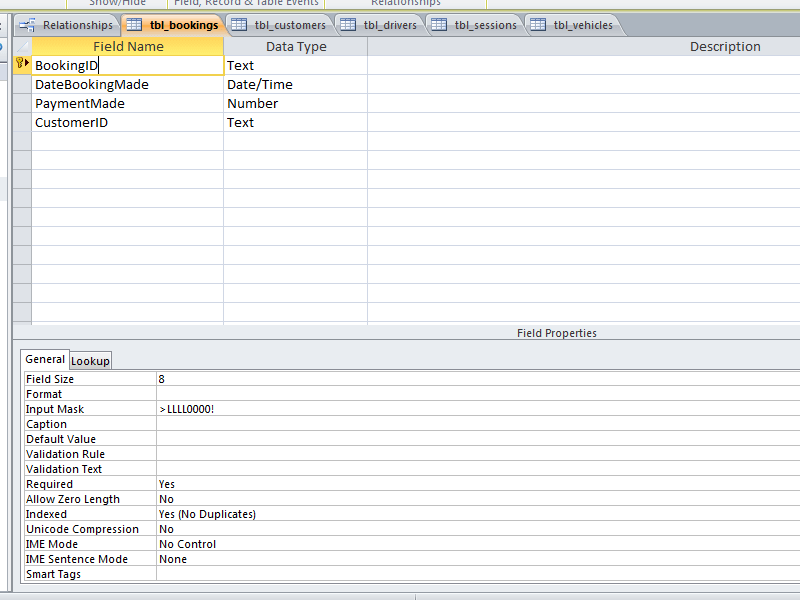 The bookings table, shown in Design View, uses an input mask allowing only valid booking IDs; those which match a certain string pattern.
Form Testing
In order to test the functionality of the forms created I simply used them to add and edit a number of new records in various tables. I purposely entered erroneous data whenever possible, in an attempt to trigger the data validation rules and input masks on particular fields. I noticed no issues with any of the forms, and feel that a novice user could use and would not be hindered by the data entry forms.
Macro/VB Testing
In order to test the macros created to generate booking and customer IDs when required, I entered various different strings in the relevant form fields. Although the macros do not generate undoubtedly unique IDs, the chances of overlap are negligible at the scale at which the database would be used. No error messages were shown, which would have provided error information, so I believe that the VBA code works as intended.
Interpreting Data [M3]
In order to make the data more accessible and easier to work with, the results from each of the queries (other than the conditional query) was exported to Excel.
Exporting to Excel
 Data in Access cannot be manipulated in the same way as it can in Excel, providing a reason to export this query, for instance.
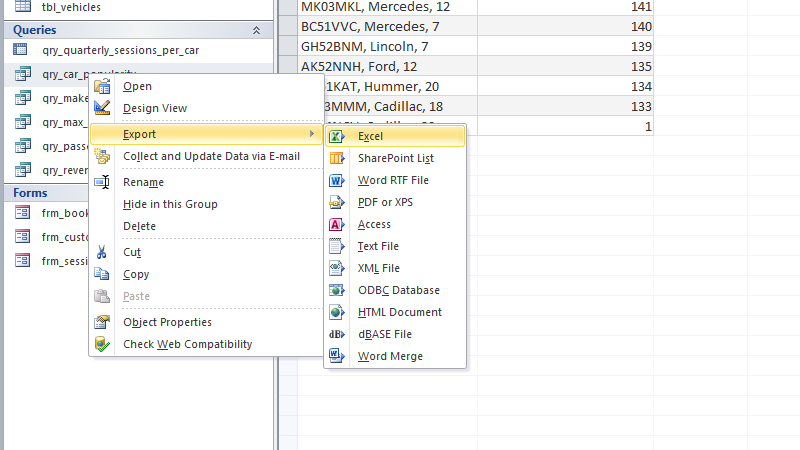 To export, once must right-click the name of the query in the left panel, and then click Excel within the Export sub-menu.
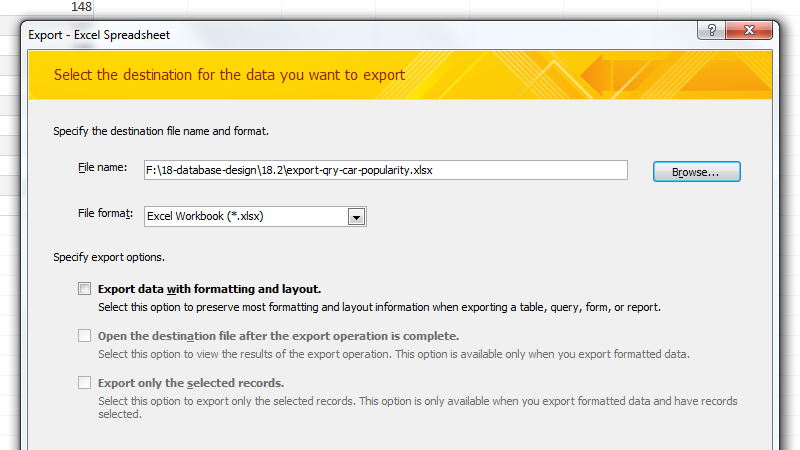 Access allows the user to select a save location for the newly generated spreadsheet, as well as a format other than Excel's if they wish. There are further options which may be used in some cases.
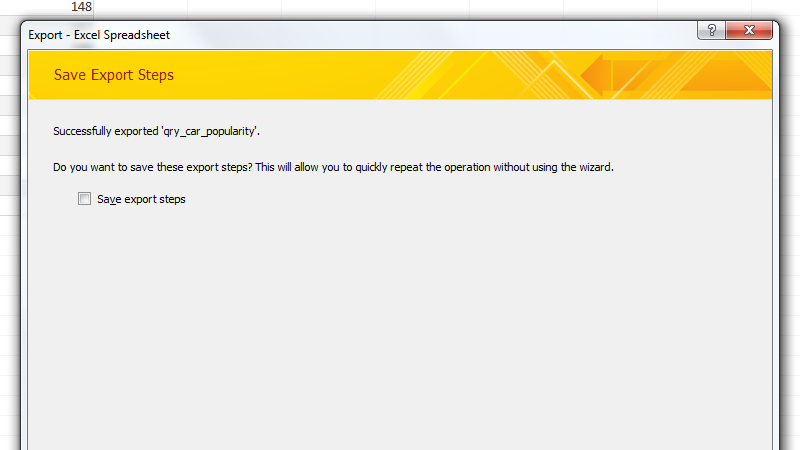 Once the export process is complete in Access, the program allows the user to save the export steps for later, which can make bulk exporting much easier.
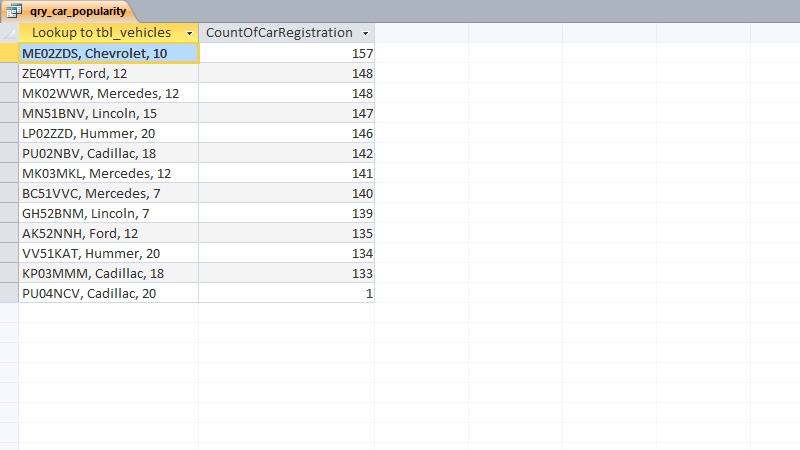
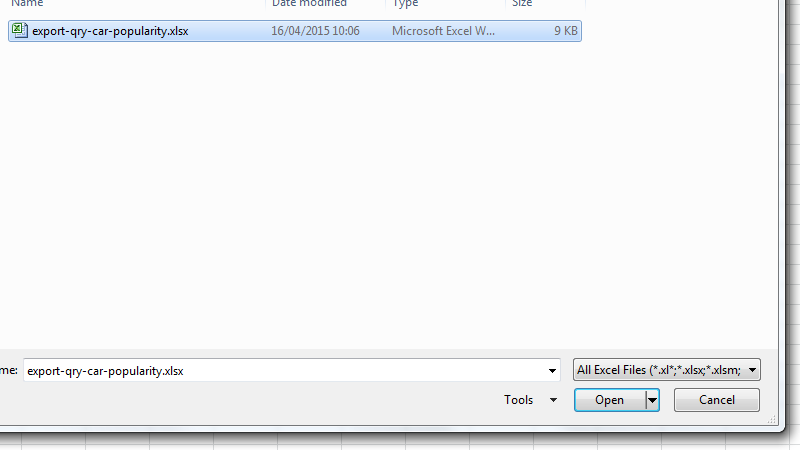 Once the data has been exported, the new spreadsheet can be opened in Excel.
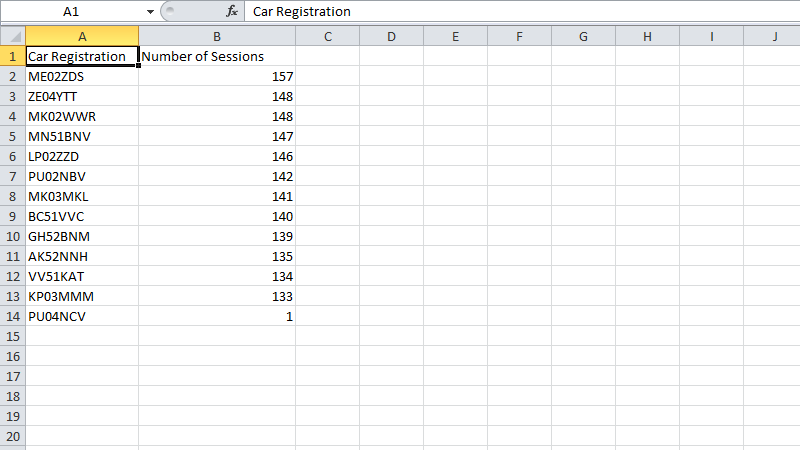 The screenshot shows the potential for the use of Excel features on the data set.
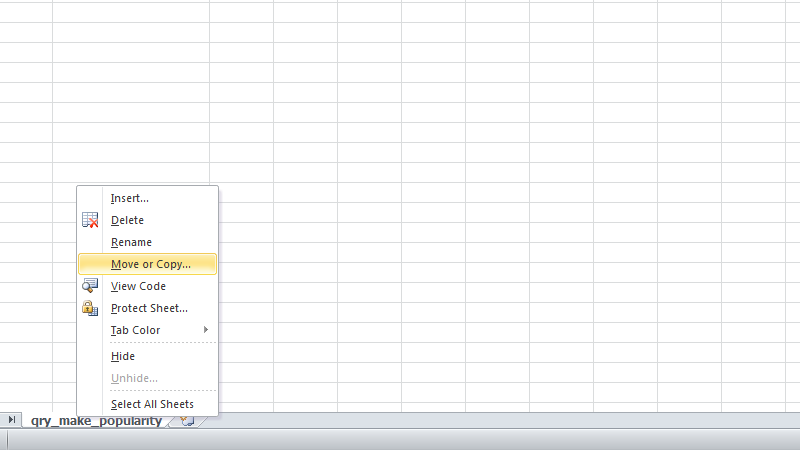 Using the Move or Copy functionality in Excel, I began placing each query's export within one multi-sheet document, rather than keeping each a separate file.
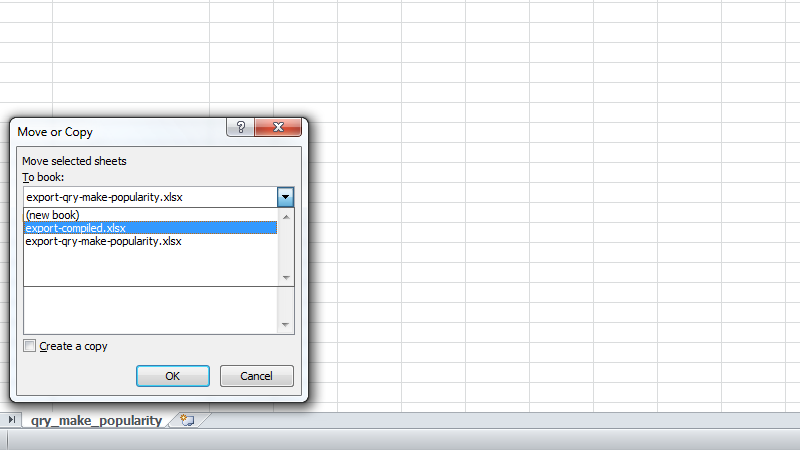 The sheets were all moved to a single new workbook I created.
Representation of Data
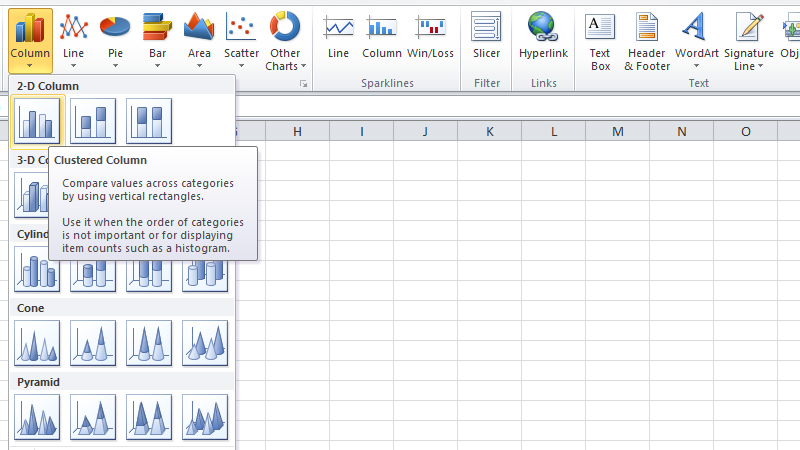 Using the various graphing tools available in Excel, one can quickly create rich visual representations of data.
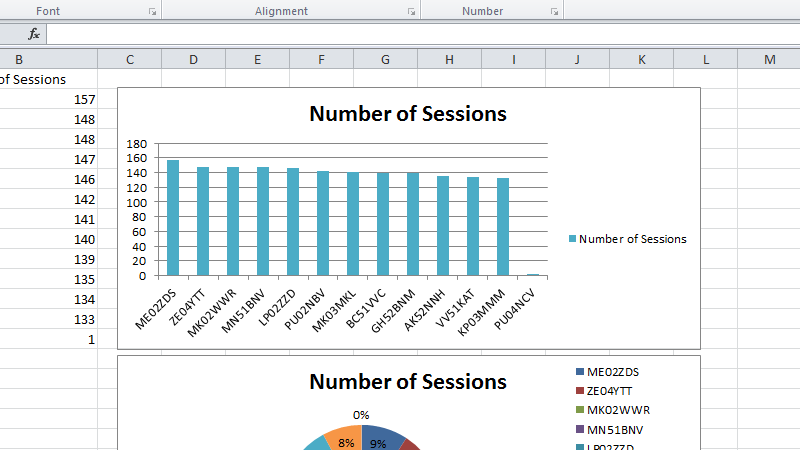 A graph showing the number of sessions that each car was used for. The single session for the car PU04NCV can be counted as an anomaly and likely a result of a mistake in record keeping.
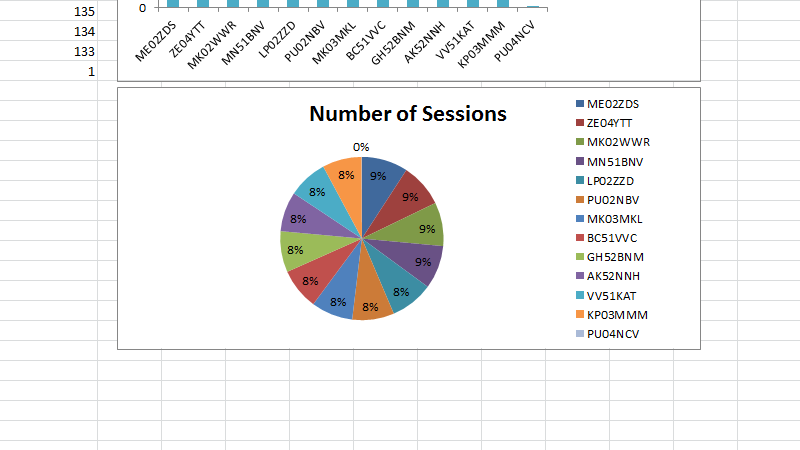 The data can also be represented in a pie chart, using percentages to show the spread of duty among the vehicles.
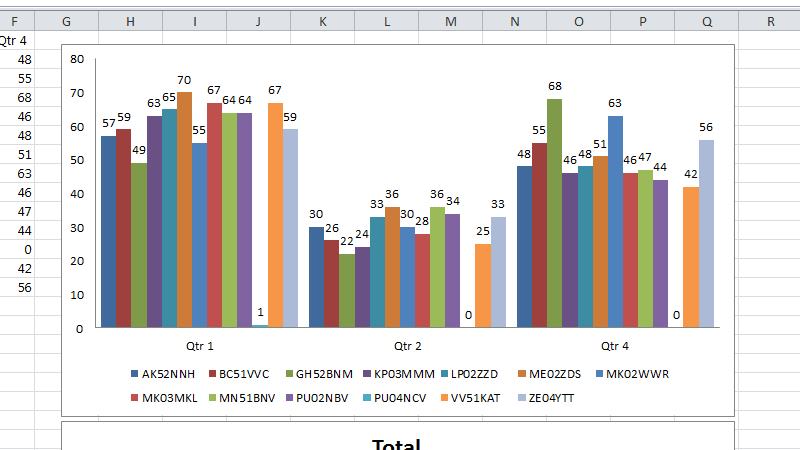 A graph showing the spread of work across the different vehicles, with respect to the three quarters with data available.
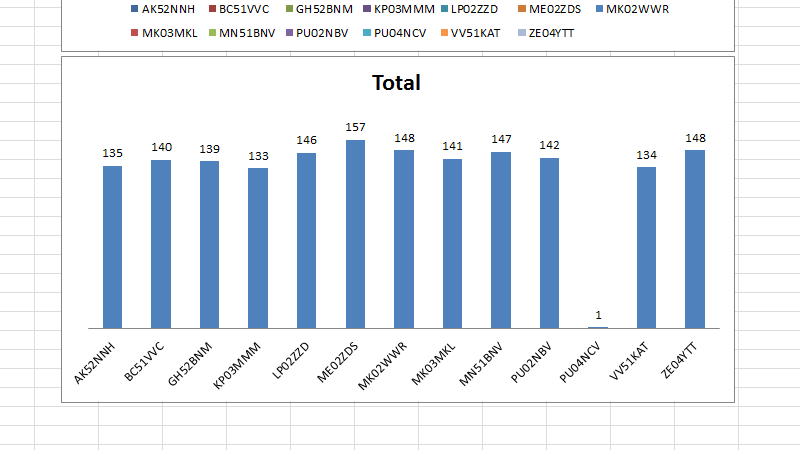 A graph showing the spread of work among the vehicles, showing the exact values above each column.
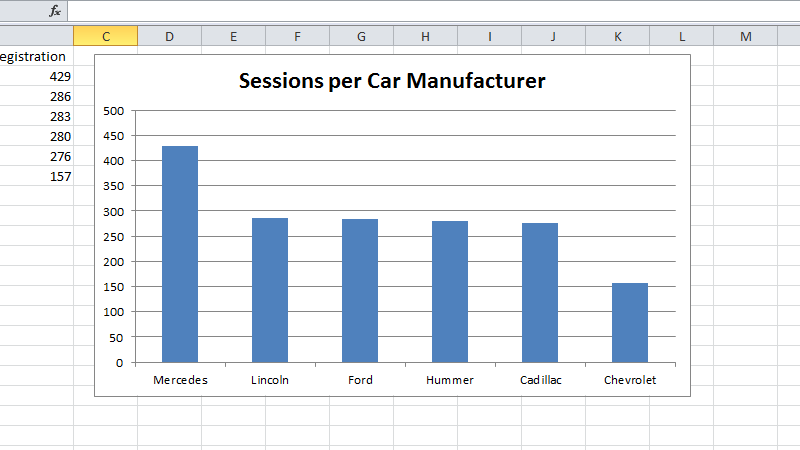 A graph showing the amount of sessions completed by cars of particular manufactures. This data could be very useful when deciding upon a new car purchase.
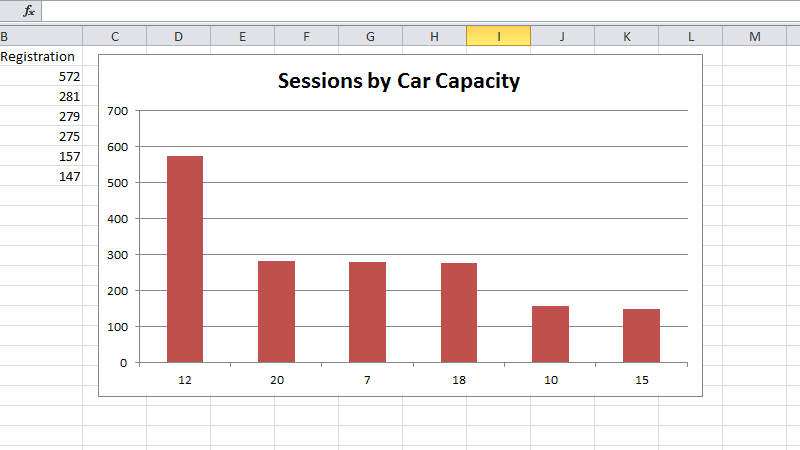 A graph showing the popularity of cars based on their maximum passenger capacity and the number of sessions completed. This too could be useful information when making a new purchase.
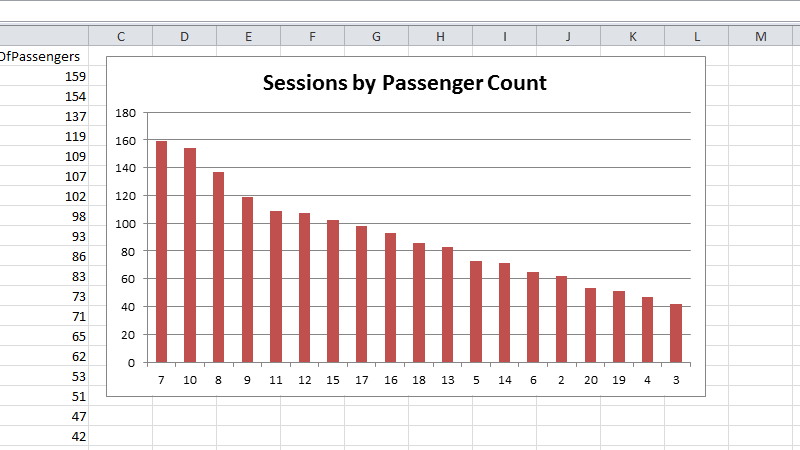 A graph showing the sessions completed with certain passenger group sizes, something useful for gauging how people most often travel.
The information extracted from the database above was analysed and a recommendation made regarding the purchase of a new car in the P5 task.